Mass Spectrometry and Infra-red Spectroscopy
Mass Spec was covered at A2
Carbon-13 NMR
NMR - Nuclear Magnetic Resonance
NMR loots for resonance in nuclei environments.
In C-13 nmr the environments in concern are those of the carbon atoms.
When looking at environments the entire chain branching off the carbon atom needs to be concerned.
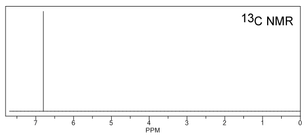
C-13 is low resolution nmr as only one peak appears for each environment.
Different environments give different peaks on a spectrum. The list is given in the exam.
NMR loots for resonance in nuclei environments.
In C-13 nmr the environments in concern are those of the carbon atoms.
When looking at environments the entire chain branching off the carbon atom needs to be concerned.
C-13 is low resolution nmr as only one peak appears for each environment.
Different environments give different peaks on a spectrum. The list is given in the exam.
|
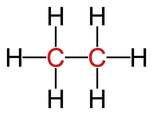
Ethane has one environment
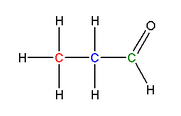
There are two carbons with the same environments as the chains connected to the carbons are the same. Propanal has three environments There are three carbons but the chain coming from the carbons are not the same so they have an environment each. |
|
Proton (H-1) NMR
Proton NMR looks for resonance of proton (Hydrogen) groups.
The entire chain is considered in the environment - when asked to show what group created a peak all the information known needs to be drawn out as a displayed formula including the amount of Hydrogens in each enviroment.
Proton NMR is high resolution spectroscopy.
Splitting Patterns
Every peak is split into either a singlet, doublet, triplet or quartet
This shows how many protons the adjacent carbons have
singlet - no protons
doublet - 1 proton
triplet - 2 protons
quartet - 3 protons
Integration Values
Integration values are the ratio of protons (hydrogens) in the environments
The integration values are shown on the spectrum via the area under the peaks.
Integration values are the ratio of protons (hydrogens) in the environments
The integration values are shown on the spectrum via the area under the peaks.
